Scripps Institution of Oceanography · CalCOFI · NOAA

Pacific Pulse

A 70-year ecosystem early warning system for the California Current — tracking ocean chemistry, biological collapse, and projecting what the ecosystem looks like in 2075.

CalCOFI Data 72 Years 414 Species Southern CA Bight 2075 Forecast DataHacks 2026
Peak Warming Year
2015
+1.75°C above baseline
Oxygen Trend
Rising
p = 0.535 — not significant
Worst Anchovy Year
2020
21.8 larvae / 10m²
Sardine 2075
~0 / 10m²
Effectively zero by 2050

The core question:
As the California Current's ocean chemistry shifts, which biological communities collapse first — and what does the ecosystem look like in 2075?

Using 72 years of Scripps/CalCOFI ocean data, Pacific Pulse tracks ecosystem stress across four biological layers and builds an early warning classifier that predicts population collapse from ocean chemistry signals one quarter before it occurs.

🌊
Ocean Chemistry
Temperature · Oxygen · Nutrients · El Niño
🐟
Fish Larvae
Anchovy · Sardine · Rockfish · Lampfish
🌿
Biodiversity Index
Shannon Index · Species Richness · Dominance

PHASE 01
Chemistry Anomaly Detection
Establish how ocean chemistry has shifted since 1949 using 72 years of CalCOFI bottle data.
PHASE 02
Biological Response — Larvae
Identify which fish species collapse first when chemistry crosses stress thresholds.
PHASE 03
Biodiversity Analysis
Track Shannon diversity, species richness, and dominance as ecosystem health metrics.
PHASE 04
2075 Ecosystem Forecast
Project current trends forward under linear trajectory to model the 2075 ecosystem state.
PHASE 05
ML Collapse Classifier
Gradient boosting model predicting quarterly collapse events from chemistry + El Niño signals.
🐟
Save the Quarter
A daily ocean science game using 30 years of real CalCOFI data. See real historical conditions — make 5 management decisions and see if the anchovy survive.
🎣 Play Today's Puzzle
Anomalies vs 1950–2000 baseline. Positive = warmer/higher than historical average. Negative = cooler/lower.
Temperature Anomaly 1949–2021 + Forecast
Dissolved Oxygen Anomaly 1949–2021 + Forecast

Chlorophyll–sardine correlation: r = 0.41, p = 0.021.
Chlorophyll A is the strongest sardine predictor — higher phytoplankton levels support sardine populations.
2014–2016 marine heat wave.
Temperature anomaly peaked at +1.75°C in 2015 — the highest value in the 72-year record — coinciding with the lowest sardine larvae counts of the modern era.
Sardine–oxygen correlation: r = 0.41, p = 0.022.
Dissolved oxygen is the second strongest sardine predictor. No significant chemistry correlations found for anchovy — El Niño and nutrient signals dominate instead.
Larvae standardized to per 10m² of ocean surface. CalCOFI ichthyoplankton tows, 1990–2021.
Northern Anchovy Larvae + 2075 Forecast
Pacific Sardine Larvae + 2075 Forecast
Rockfish Larvae 1990–2021
Oxygen vs Sardine Larvae (r=0.41, p=0.022)
2020 anchovy catastrophic collapse.
Dropped to 21.8 larvae/10m² — the ML model assigned only 0.8% collapse probability, suggesting a non-chemistry driver.
Sardine trajectory: effectively zero by 2050.
Under linear trend extrapolation, sardine larvae drop to effectively zero in the Southern California Bight by 2050 — a local reproductive collapse under current conditions.
Linear trend projections — "if nothing changes" forecasts.
Sardine larvae trend models local reproductive collapse by 2050 under current trajectory.
Multi-Species Forecast to 2075
Temperature 2075
15.94°C
up from 14.32°C in 2021
Oxygen 2075
5.83 ml/L
up from 5.76 ml/L in 2021
Anchovy 2075
~58 / 10m²
down from ~586 in 2021
Sardine 2075
~0 / 10m²
effectively zero by 2050
Ocean Trends 1949–2021
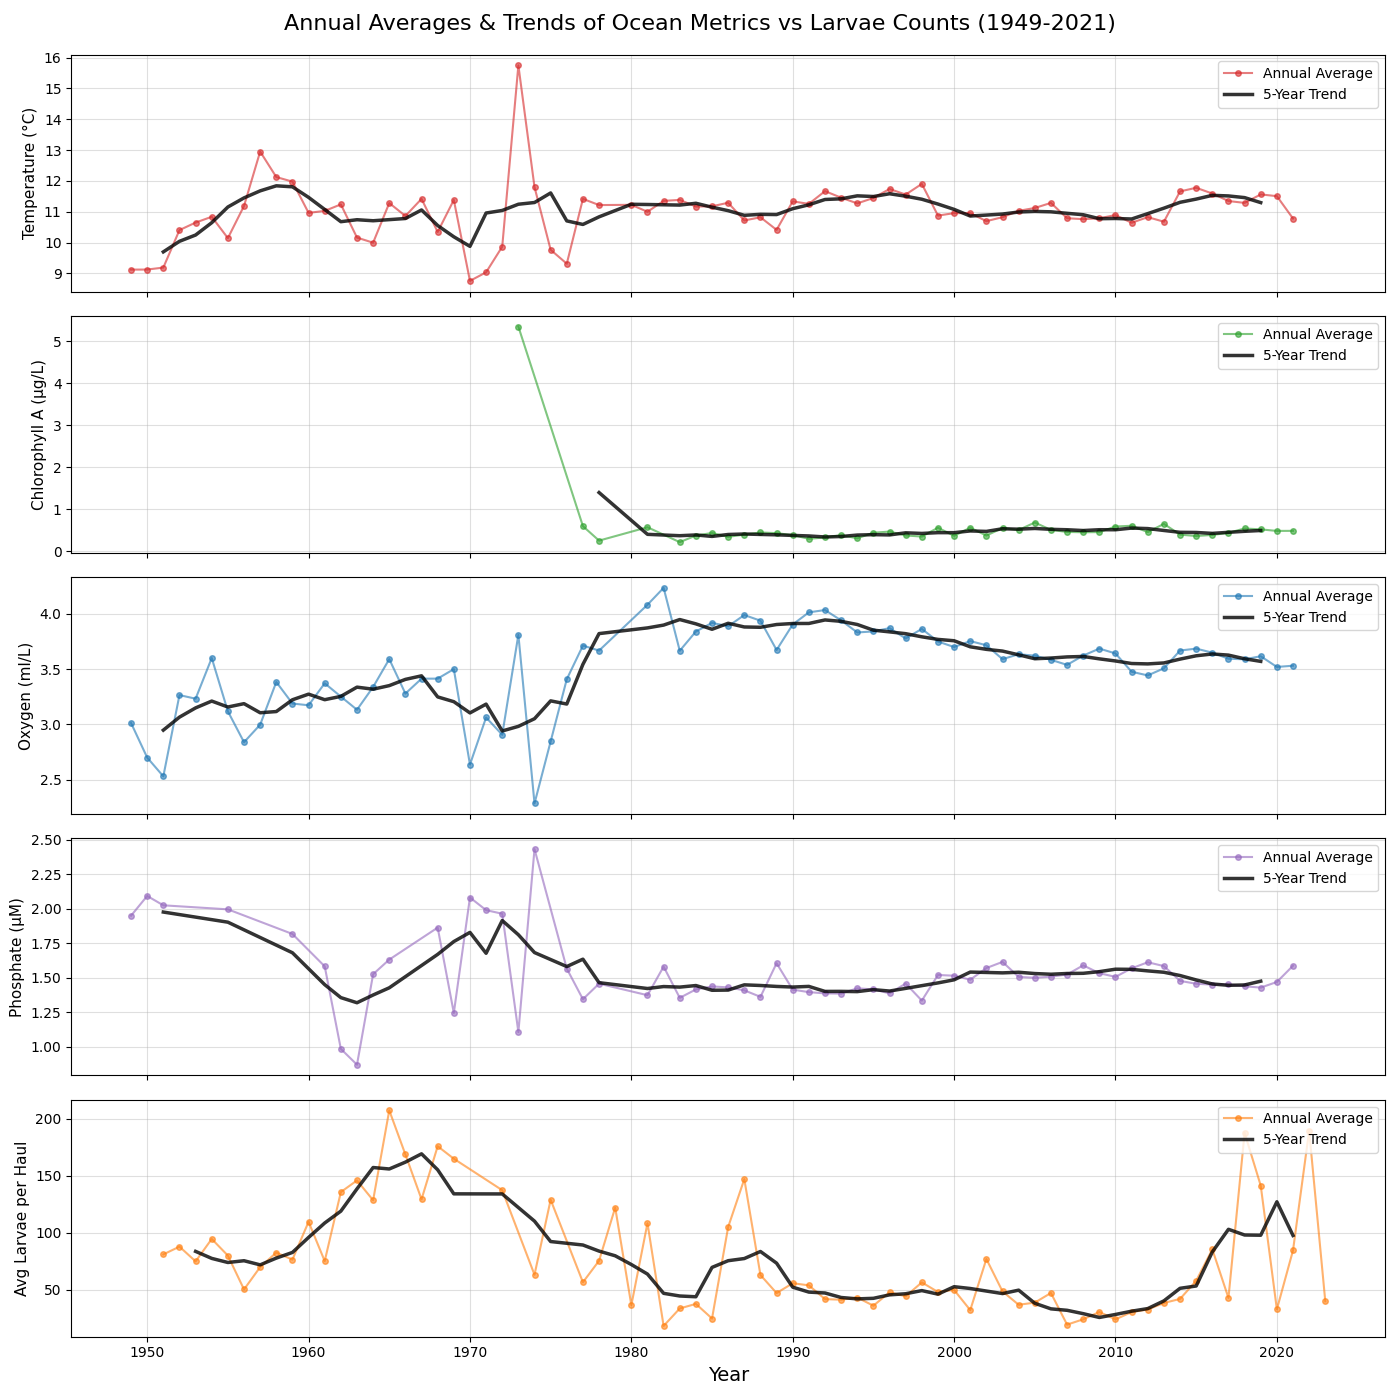
Measuring temperature, oxygen concentration, chlorophyll, phosphate, and larval count along the western coast over the past 70 years. We see a steady decline in oxygen levels over the past 30 years, reflecting findings from research projects like one from Georgia Tech. We see a slow rise in temperature as well. These larger trends seem to explain the overall decline in larvae hauls — with the exception of the anomalies in more recent times — with populations being unable to sustain themselves in worsening conditions.
Gathered from the CalCOFI bottle dataset and the CalCOFI larvae dataset.
Annual averages and trends of ocean metrics vs larvae counts 1949-2021

Habitat Shift: Southern CA vs Central CA
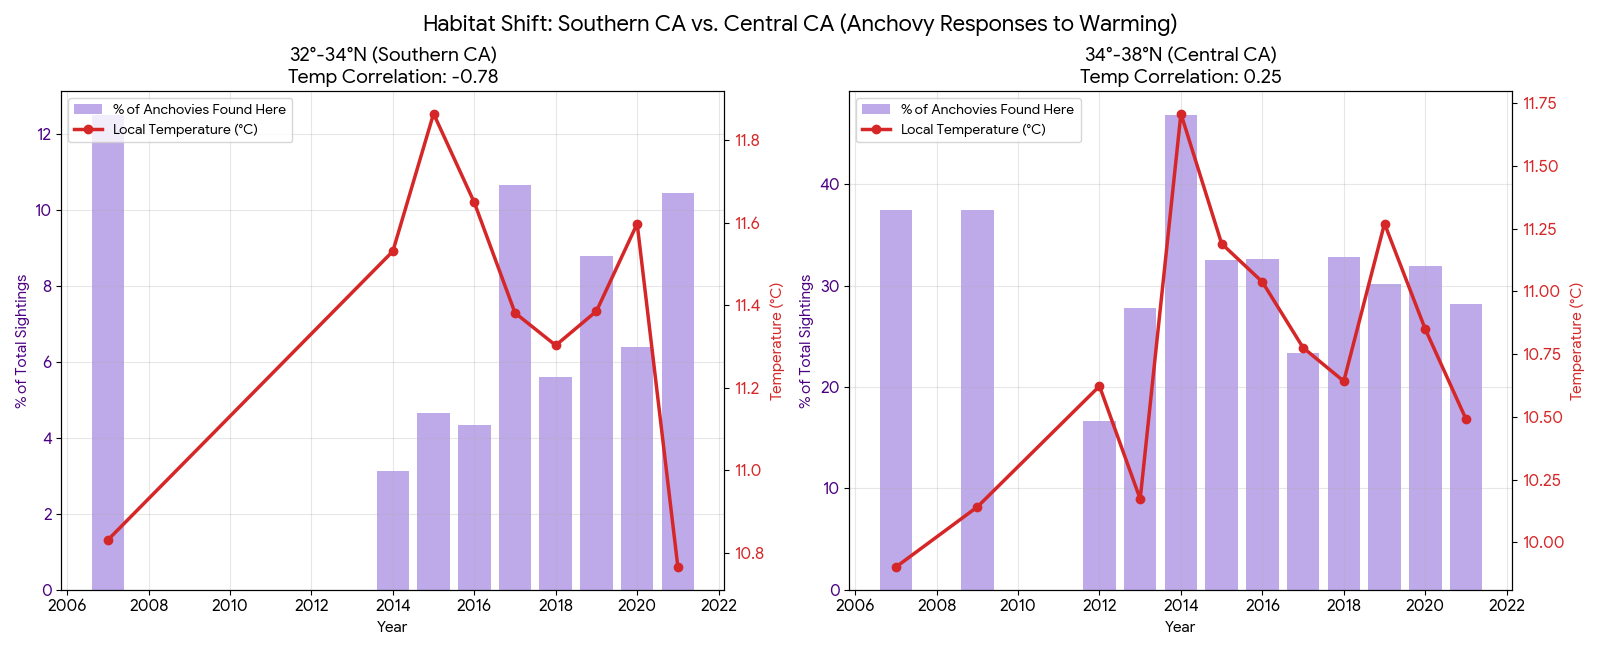
In Southern California, we see a significant negative correlation between temperature and anchovy sightings (measured by number of sightings found in the given area divided by total sightings that year), with a peak in temperature in the mid 2010s correlating with fewer anchovies being seen in Southern California. We see little correlation with a small positive coefficient in the Central California area, which could be explained by warming temperatures reaching more ideal levels for the fish.
Gathered from the CalCOFI bottle database and the iNaturalist species dataset.
Habitat shift Southern CA vs Central CA anchovy responses to warming
Task: Binary classification — predict whether next quarter will be a collapse event.
Algorithm: Gradient Boosting Classifier (scikit-learn)
Validation: Temporal split — trained 1990–2010, tested 2011–2021
Collapse definition: Larvae below seasonal 25th percentile
🌡️ Temperature anomalycurrent + lag1
💧 Dissolved oxygen anomalycurrent + lag1
🧪 Phosphate anomalycurrent quarter
🧪 Nitrate anomalycurrent quarter
🌿 Chlorophyll anomalycurrent quarter
🌊 El Niño index (MEI)current + lag1 + lag2
🐠 Shannon diversity indexcurrent + lag1
📊 Species richnesscurrent + lag1
📊 Dominance indexcurrent quarter
🐟 Northern Anchovy
Engraulis mordax
111 quarterly obs · AUC 0.730
🐟 Pacific Sardine
Sardinops sagax
84 quarterly obs · AUC 0.461 (poor)
🐠 Rockfish
Sebastes spp.
future work
🔦 Northern Lampfish
Stenobrachius leucopsarus
future work
Anchovy AUC-ROC
0.730
Good — temporal validation
Anchovy Precision
80%
Low false alarm rate
Sardine AUC-ROC
0.461
Poor — too noisy
Top Feature
NO3uM
23.2% importance
ROC Curve — Anchovy Classifier
Feature Importance

Nitrate (NO3uM) is the dominant early warning signal.
Nitrate accounts for 23.2% of total feature importance in the anchovy classifier — more than any other single variable. Temperature lag and oxygen lag follow at 12.6% and 12.1%.
80% precision on anchovy collapse predictions.
When the model predicts a collapse quarter it is correct 4 out of 5 times. Recall is lower (40%) — it misses some events, but the false alarm rate is low.
2020 anchovy collapse not predicted (0.8% probability).
The worst anchovy year on record was not flagged by chemistry or El Niño signals — suggesting a driver outside the current feature set (disease? COVID-19 sampling gaps?).
Sardine model fails (AUC = 0.461).
With only 84 quarterly observations and high natural variability, sardine cannot be classified reliably. This is an honest finding — we report it rather than hiding it.
Future Projection: Clean Water Probability (2026–2050)
Adjust nitrate reduction policy and climate scenario to see how clean water probability changes over time. Based on a Random Forest classifier trained on CalCOFI oxygen and nitrate data. Clean water = above-median oxygen AND below-median nitrate.
Nitrate Reduction % (Policy Intervention): 0%
0%20%40%60%80%100%
Sea Surface Temp Anomaly °C (Climate Scenario): +0.0°C
+0.0°C+0.5°C+1.0°C+1.5°C+2.0°C+2.5°C+3.0°C
Clean Water Probability 2026–2050
2026 Probability
baseline year
2035 Probability
mid-term
2050 Probability
end of projection
How to read this: Drag the sliders to simulate policy and climate scenarios. Higher nitrate reduction (policy intervention) lifts the probability curve. Higher temperature anomaly pushes it down. The model uses baseline nitrate of 3.04 µmol/L and baseline temperature of 14.42°C from CalCOFI surface data.

Pacific Pulse was built for DataHacks 2026 using openly available data from the Scripps Institution of Oceanography, NOAA, and OBIS SEAMAP. The project combines 72 years of CalCOFI ocean chemistry measurements with biological response data across multiple trophic levels to build an ecosystem early warning system for the California Current.

CalCOFI Bottle + Cast Data
Scripps Institution of Oceanography / NOAA
Ocean chemistry: temperature, salinity, oxygen, nutrients, chlorophyll. 1949–2021.
CalCOFI Fish Larvae Counts
NOAA SWFSC — coastwatch.pfeg.noaa.gov
Ichthyoplankton tow data for 414 species. 1990–2021.
Seabird + Marine Mammal Sightings
OBIS SEAMAP — Dataset 507
70,705 at-sea sightings from CalCOFI cruises. 1987–2006.
Multivariate El Niño Index (MEI v2)
NOAA Physical Sciences Laboratory
Bimonthly El Niño/La Niña intensity index. 1979–present.
iNaturalist Species Observations
iNaturalist / California Academy of Sciences
Anchovy sightings used for habitat shift analysis. 2007–present.
📊 Data Analytics
70-year trend analysis, correlation study, habitat shift analysis, and 2075 ecosystem forecast.
🤖 Machine Learning
Gradient boosting collapse classifier with temporal cross-validation.
Python 3.13PandasNumPyScikit-learnSciPyChart.jsCalCOFI ERDDAPGitHub Pages
Scripps Challenge.
Uses CalCOFI dataset from Scripps Institution of Oceanography — eligible for the $1,500 Scripps Challenge.